
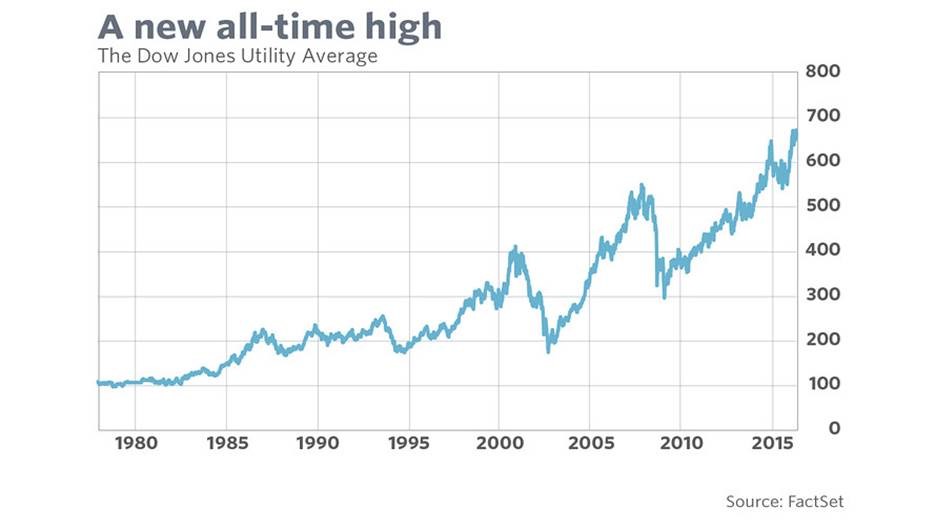
The Dow Jones Utility Average (DJU) was created back in 1929 to house utility stocks previously represented in the Dow Jones Industrial Average (DJIA). In a recent article published by MarketWatch, columnist Mark Hulbert asserts that the new high is good news for the stock market as a whole, but the party won’t last forever.
According to Kelley Wright, editor of Investment Quality Trends (one of the myriad newsletters Hulbert tracks), “The DJU has tended to bottom and top three to six months before the Dow Industrials.” This view is confirmed by data collected by Ned Davis Research regarding the best and worst industry performers in the three months preceding every bull market since 1970. The research showed that the utilities sector tended to be one of the worst-performing sectors during that period, but that’s not what we’re seeing now.
However, Wright says the long-term outlook isn’t necessarily rosy. He says the DIJU’s dividend yield fluctuation of between 6% and 3% represents respective areas of undervalue and overvalue. With that in mind, Wright considers the index’s current yield of 3.3% to be “statistically within the overvalued area of the index.”