
By Jack M. Forehand (@practicalquant) —
One of the most common comparisons I hear for the current state of the stock market is the bubble of the late 90s. With the market seemingly setting new highs every day, valuations stretched, and technology stocks leading the way, there appear to be many similarities on the surface. When you look deeper, however, there are also some clear differences.
Given that the 90s rally ended on a bad note and that many predict the same ending to the current bull market, I wanted to take a look at the similarities and differences between the two periods to gain better clarity and understanding.
Similarity #1: The Market is Overvalued and Tech Stocks are Leading the Way
The most common comparison drawn is that both show signs of significant overvaluation using traditional metrics. For example, the chart below shows the Shiller PE ratio from the late 1800s to today. We have now reached a valuation that surpasses all historical peaks except the late 90s:
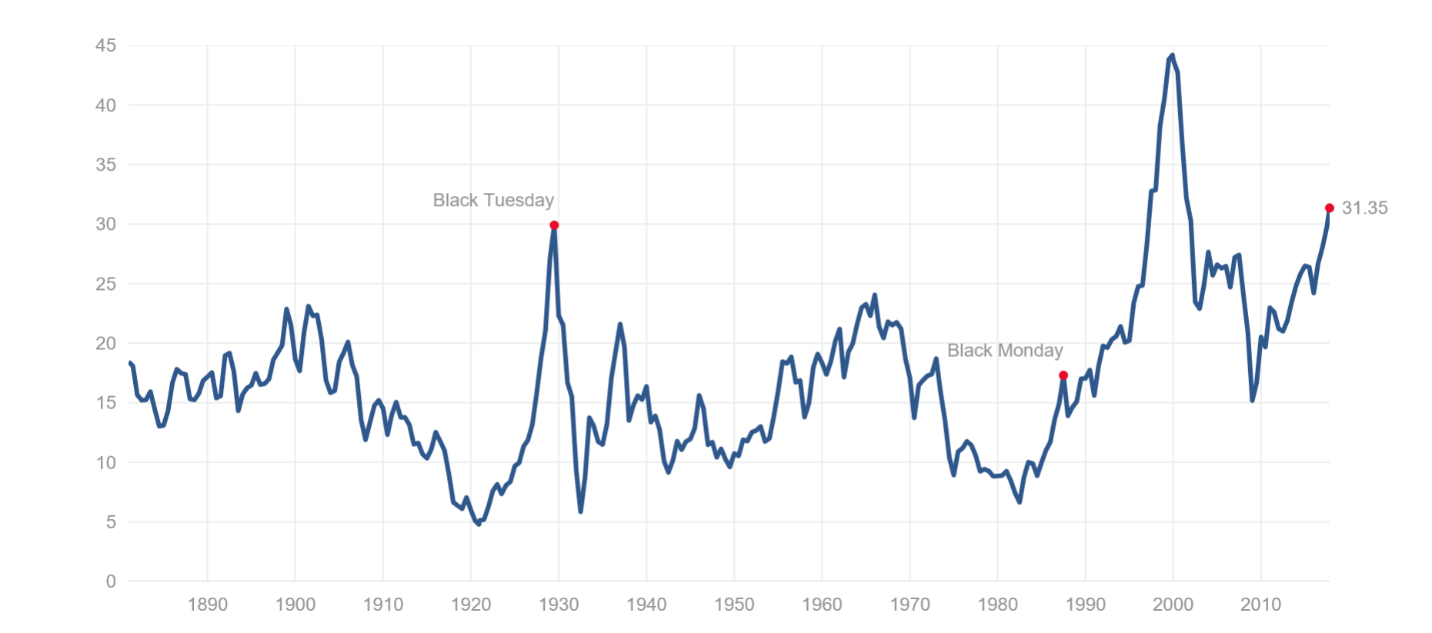
Source: http://www.multpl.com/shiller-pe/
And the traditional PE ratio tells the exact same story:
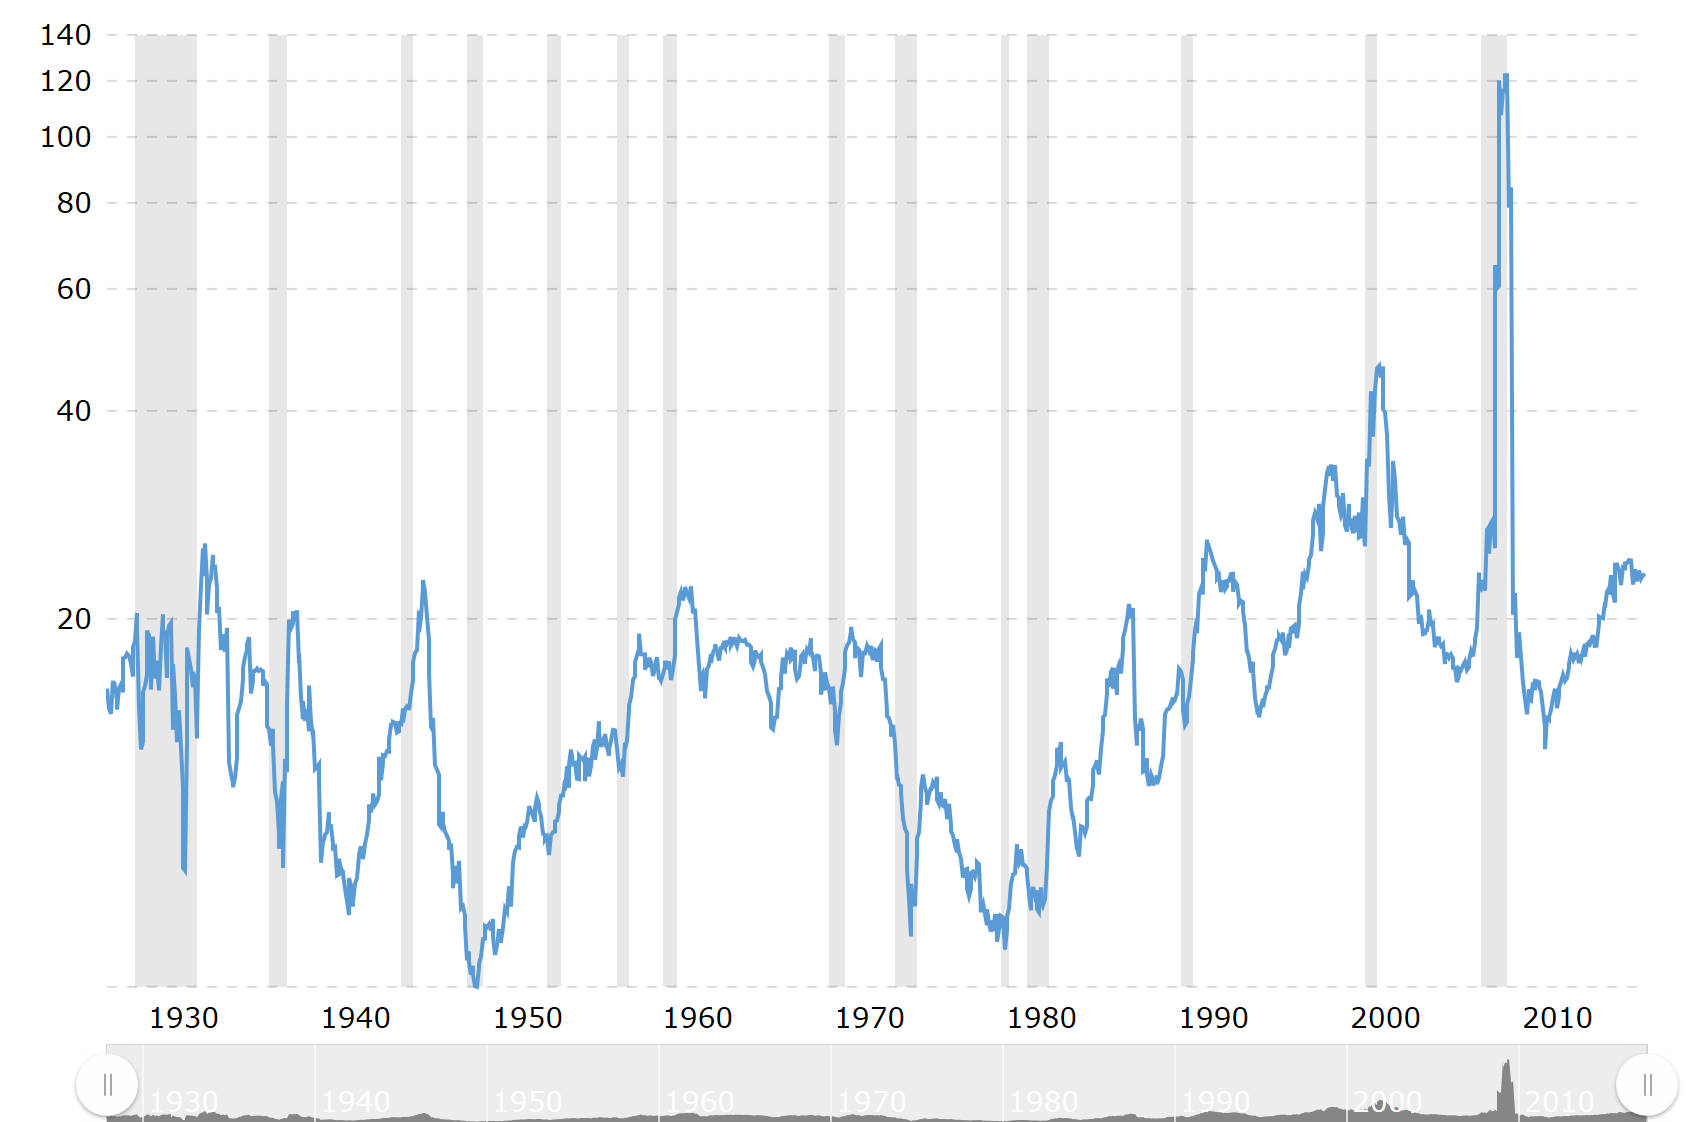
Source: http://www.macrotrends.net/2577/sp-500-pe-ratio-price-to-earnings-chart
Other than an anomaly that occurred in 2009 because of the big decline in earnings following the financial crisis, the current valuation also rivals all the historical market peaks, except that of early 2000.
Further, in both periods, large-cap growth stocks, particularly technology stocks, led the way and small-cap value stocks lagged badly.
Difference #1: The Market is Less Overvalued Than it Was in the Late 90s
A more detailed look at the valuation picture leads to the first major difference. Although both charts above clearly show that the market is currently overvalued relative to history, they also show that we are still well below the early 2000 peak.
I am not aware of any valuation indicator from the late 90s that didn’t show extreme overvaluation. Today, there is one important valuation metric that shows the market is potentially fairly priced; the ratio of earnings yield to bond yields.
The chart below from the Leuthold Group illustrates this. Since bond yields are so low right now, equities look good as an alternative. Based on this metric, the market is very close to its average historical valuation:
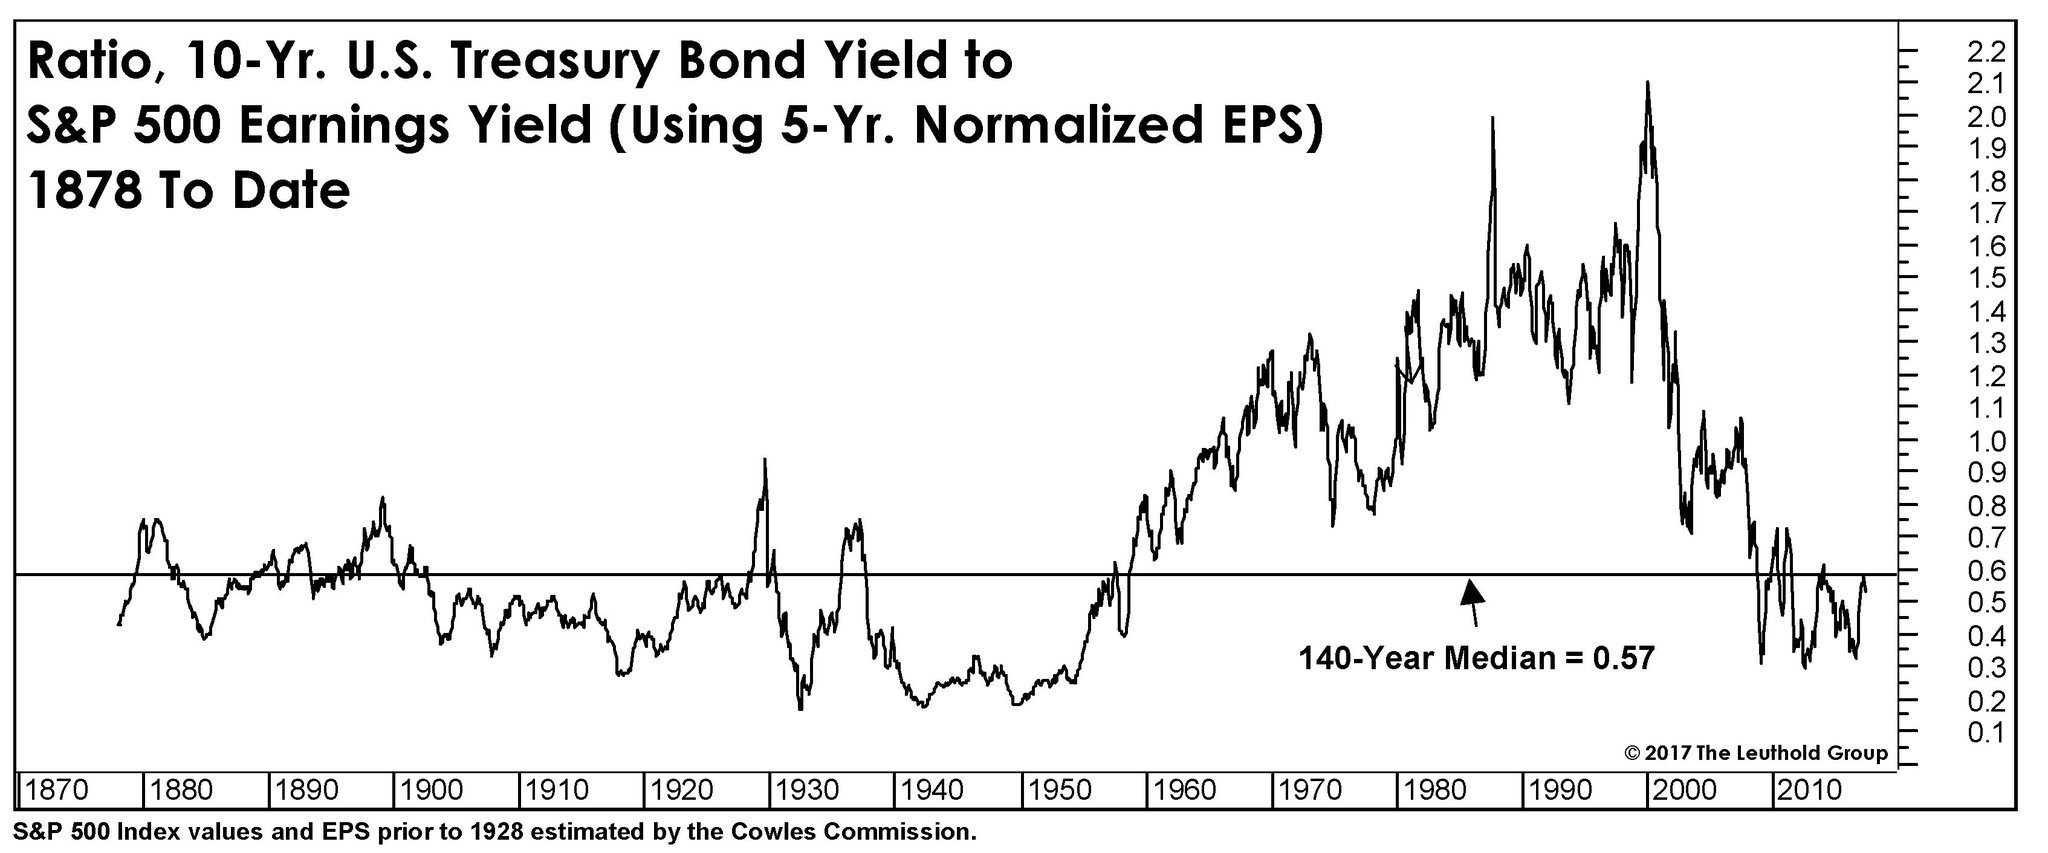
Source: Leuthold Group
One of the other big differences between the two periods with respect to valuation is how value was assigned.
In the late 90s, I worked in the Internet space, and got an inside look at how venture capitalists were valuing these firms. They certainly weren’t using earnings, since there weren’t any. They weren’t even using sales, since these were also in short supply. Instead, they were using things like page views and unique visitors, and market share in markets where no company was making any money.
The same approach was used for public companies. The priority was to grow as much as possible and focus on sales and earnings later. The problem, obviously, was that many firms had no real prospects to ever achieve significant sales or earnings.
The current market rally is very different, however. You can argue all you want about how overvalued the FAANG stocks are, and there are certainly strong arguments to support that thesis, but these are legitimate businesses that are either making money or have the potential to generate profits, but have decided to forgo them in pursuit of long-term growth. In the last 12 months, Apple has generated over $223 billion in revenue and over $46 billion in profits. It holds $261 billion in cash on the balance sheet. Alphabet (Google) has realized $99.2 billion in sales over the past year and has produced a profit of $19.3 billion. This is completely different than the late 90s, when many public companies really had no chance of ever building a sustainable or profitable business.
Difference #2: Euphoria is Dramatically Lower
The late 90s were characterized by the highest level of euphoria I have seen in my career. Everyone seemed to believe that the world had changed in such a profound way that this time would be different than any other time in history. Everyone seemed to believe that the market could not go down and, despite the huge run up in stocks, the rise had only just begun.
It is hard to characterize that period if you didn’t live through it, but is was nothing like today.
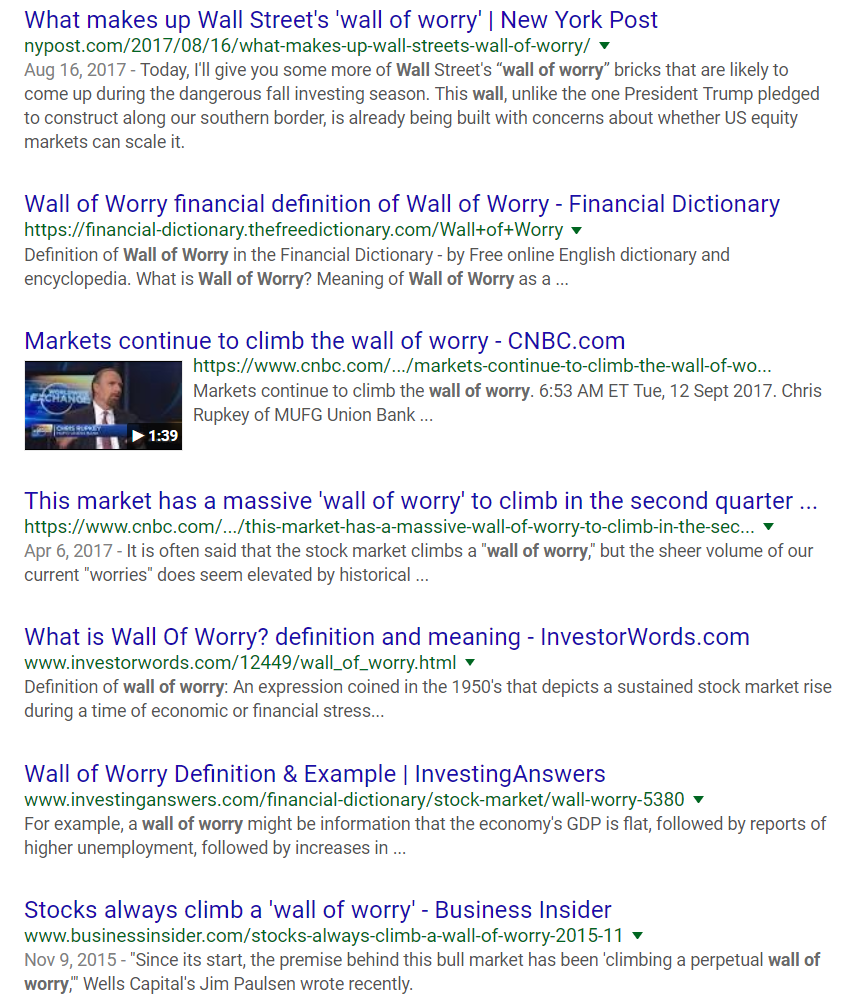
The term I have most often seen used for this market is that we are climbing a “wall of worry.” For years now, there has been significant talk about whether the market is overvalued or has come too far too fast. There seems to always be some sort of catalyst in the news that people feel will be the one that finally causes the correction or triggers a bear market. A simple search for “wall of worry” on Google will return more articles than you can possibly read. Some examples from the current top results are below.
The late 90s were not only not characterized by a wall of worry, they weren’t characterized by any worry at all. And that type of euphoria is much more characteristic of a market top than what we see today.
The lack of euphoria has also translated into fewer investors owning stock. For example, a Gallup poll from May of this year shows that stock ownership in the U.S. in the period of 2009-2017 is down from the period of 2001-2008. As the poll data points out, “The stock market lost more than half of its value during the bear market that coincided with the Great Recession and 2008 financial crisis, with many investors responding by taking their money out of the market. Although the stock market has more than made up for those losses, reaching record highs this year, Gallup’s data indicate that fewer Americans today are in a position to benefit from those gains.”
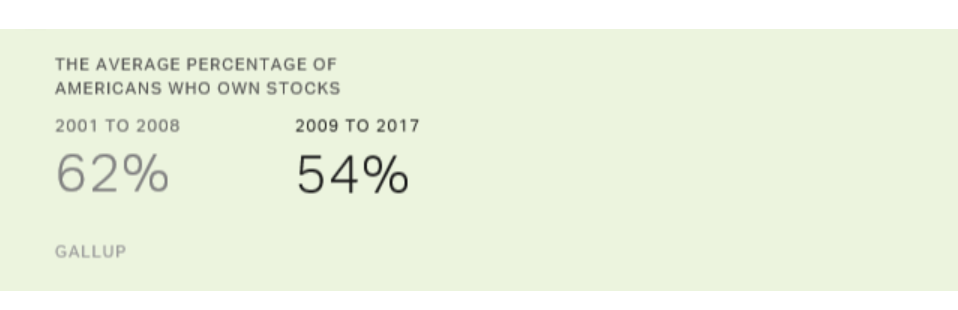
Source: http://news.gallup.com/poll/211052/stock-ownership-down-among-older-higher-income.aspx
Difference #3: Wall Street Has Not Joined the Party Like it Did in the 90s
The late 90s were also a time when Wall Street was prospering. Fees were high, IPOs were coming out every day, returns were off the charts, and active managers were gaining assets. The chart below is a little dated (from 2013), but it does a great job capturing the magnitude of what was going on:
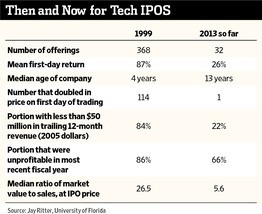
Source: https://www.wsj.com/articles/tech-valuations-stir-memories-of-the-dotcom-bust-1382916515
It is hard to even fathom this from today’s point of view, but there were 368 technology IPOs in 1999 and those IPOs were up an average of 87% on the first day. That is a recipe for massive Wall Street profits, which is exactly what occurred.
Today, we live in a world where IPOs are scarce, computers are replacing people, and money is flowing out of active management at an incredible pace.
So, instead of investors paying 2 and 20 to hedge funds or 1.5% fees to mutual funds, they are paying 8 bps to Vanguard. Profits for Wall Street and optimism about business in general just aren’t there like they were then.
Josh Brown wrote an excellent piece about this a while back which I highly recommend. He summed up the current situation, as follows:
There has never been an asset bubble in which the industry that catered to that asset didn’t participate. Wall Street has never had an extended bull market during which everyone spent the entire time worrying.
Can you imagine a real estate boom where the brokers and mortgage people stood on the sidelines, forlorn and only taking part out of obligation? How about a gold boom where the miners told polls every week how bearish they were?
Unheard of.
Until now. Job insecurity will do that to people.
I can’t say what this means for the current market rally but, as Josh pointed out, we are in uncharted territory here because Wall Street is not really participating in the upside. The late 90s were totally different from that perspective.
Similarity #2: Overvaluation Lasted for a Long Time
I consider this one of the most important points about bull markets because it happens in nearly all of them.
The market always gets overvalued and then stays that way for far longer than anyone thinks it can. This is why calling market tops based on valuation is a waste of time. If you use the 1999 model to analyze this bull market (and I certainly am not saying you should), the current rally could go on for years.
Looking at the Shiller PE chart above, the current market valuation matches up to about mid-1997. The S&P 500 returned 20%+ per year for almost 3 years after that,–hard to even fathom given the market rally we have seen.
That isn’t to suggest it will do the same thing now. The odds are it won’t. But what it does suggest is that valuation is a terrible short-term timing indicator, and market rallies tend to go on much longer than you think they will. That was true of the late 90s rally, and has also been true of this one.
Every Market is Different
So what can we conclude from all of this? Ultimately, I think every market is different. The 90s bull market is similar to this one in that they both lasted a long time, the returns were significant, and valuations were high. But the euphoria of that market, both when it comes to individual investors and professionals, was completely different. Many stocks that led the run in the 90s did not have sustainable business models, and the stocks leading the market higher today are some of the most successful companies in the world.
Assuming any market will play out exactly like any past market is just setting yourself up for failure. This bull market could end tomorrow or it could go on for years. No one really knows and you should be very wary of anyone who tells you that they do. But I think learning from the past is something we all should do, as long as the past is put in the proper context. As a factor-based investor who focuses on value and small-caps, I certainly wouldn’t mind if this bull market ends like the prior one, since small-cap value stocks basically didn’t go down at all in the bear market that followed, while the S&P 500 went down 40%. But I am also smart enough to know that, just like a lot of other things about the market, I can’t predict that. That may be the biggest lesson learned from any part of market history, including the late 90s.
——-

Jack Forehand is Co-Founder and President at Validea Capital. He is also a partner at Validea.com and co-authored “The Guru Investor: How to Beat the Market Using History’s Best Investment Strategies”. Jack holds the Chartered Financial Analyst designation from the CFA Institute. Follow him on Twitter at @practicalquant.