By Jack Forehand —

When we started following guru-based models, the term factor investing didn’t exist. We just wanted to find a way to outperform the market, and we realized that only a very small group of investors had successfully done that – and we certainly weren’t in that group. So we decided to follow investors who had long-term records of beating the market and whose strategies could be quantified. We read their books and research papers to try to find out how they did it. We researched strategies by legendary investors like Warren Buffett, Ben Graham, and Peter Lynch, and also looked at academic research papers by lesser known names, like Joseph Piotroski. As we analyzed those writings, we realized that their published strategies could be broken down into a series of fundamental investment factors. We then built model portfolios that held the highest scoring stocks using those factors.
Fourteen years later, we have now captured over 40 quantitative, factor-based models. These models cover a wide range of investing styles ranging from value to growth to momentum. Our new Factor Strategy Focus series will be a way for us to share these models, the factors they use, and their performance since we began following them.
The first strategy we will look at is also the oldest. It is based on the Defensive Investor model outlined by Benjamin Graham in his book The Intelligent Investor.
About Benjamin Graham
Graham may be the oldest of the gurus we follow, but his impact on the investing world has lasted for decades after his death in 1976. Known as both the “Father of Value Investing” and the founder of the entire field of security analysis, Graham mentored several of history’s greatest investors — including Warren Buffett — and inspired a slew of others, including John Templeton, Mario Gabelli, and another of Validea’s gurus, John Neff. Graham built his fortune and reputation after living through some extremely difficult times, including both the Great Depression and his own family’s financial woes following his father’s death when Benjamin was a young man. His investment firm posted per annum returns of about 20 percent from 1936 to 1956, far outpacing the 12.2 percent average return for the market during that time.
About This Strategy
Not surprisingly, given that he lived through his family’s financial troubles and the Great Depression, Graham used a conservative, risk-averse approach that focused as much on preserving capital as it did on producing big gains. Trendy, hot stocks didn’t garner his attention; he was concerned with companies’ balance sheets and their fundamentals. How much debt did they carry? How did their stock price compare to the amount of per-share earnings they were generating? Did the firm have strong sales figures? This value-centric, company-focused approach may be used by a lot of investors today, but it was Graham who first popularized it. A key concept behind his approach was the “margin of safety” — the difference between a stock’s price and the value of its underlying business. Graham focused on stocks with high margins of safety (meaning their stocks were selling on the cheap compared to what he believed to be the intrinsic value of their businesses), because their already low prices offered significant downside protection.
Factors Used in Strategy
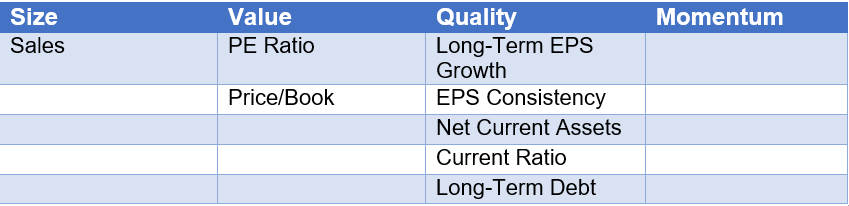
The following are the individual factors used within this strategy. We have grouped them by the widely used factor categories: Size, Value, Quality, and Momentum.
Below are some details about each criteria, as well as a look at how our current investable universe of 3000 stocks gets filtered down at each step of the process.
Staying true to Graham’s approach, the model shuns both financials and technology stocks as these companies were considered too speculative in Graham’s mind. The factors below are applied to all other sectors.
Size Criteria
- Sales: Graham used the sales criteria to eliminate smaller firms that may not be able to weather a market downturn. We have adjusted the original criteria for inflation and require that sales be above $1 billion.
Stocks Remaining After This Step: 2189
Value Criteria
- PE ratio: Graham looked for stocks where the PE ratio was reasonable. He also wanted to ensure that the PE ratio was not artificially low at the current time due to cyclical factors. For that reason, we require that both the current year and 3 year PE ratio be below 15.
Stocks Remaining After This Step: 179
- Price/Book ratio: As another measure of value, this methodology also looks at the Price/Book. When the Price/Book and PE Ratio are multiplied, the result should not be greater than 22.
Stocks Remaining After This Step: 125
Quality Criteria
- Long Term EPS Growth: As an indication that at least some long-term growth has occurred, this model looks for 30% cumulative EPS growth over the past 10 years. This is not a strict criteria since 30% growth over 10 years is only slightly less than 3% annually, but it does ensure some degree of growth in the underlying business.
Stocks Remaining After This Step: 74
- EPS Consistency – This methodology also requires that EPS be positive for each of the past 10 years. This consistency in results was important to Graham as he wanted to avoid companies with losses.
Stocks Remaining After This Step: 33
- LT Debt in Relation to Net Current Assets: Graham liked to see companies whose long-term debt was less than net current assets (current assets minus current liabilities). A company that meets this criteria exhibits significant financial strength because it can pay both its short and long-term debt from current assets.
Stocks Remaining After This Criteria: 3
- Current Ratio: As a sign of financial stability, the Graham model likes to see a current ratio above 2. This ensures the company has the resources to weather any short-term storms that may arise.
Stocks Remaining After This Criteria: 1
As is probably evident with only 1 stock out of 3000 meeting all the tests of this model at the current time, this is a very stringent value methodology. By most traditional measures, the market certainly appears to be richly valued right now, which plays a big role in that, but even at the market bottom in early 2009, only about 35 companies out of 3000 met this strategy’s tests with 100% score.
One additional note. The original Graham Defensive Investor strategy included a requirement for 20 years of consistent dividend payments. Our strategy does not include this requirement for a couple of reasons. First, the percentage of companies paying dividends is lower than it was during Graham’s time. Using excess cash to buy back shares and reinvest in the business, both of which benefit shareholders, are more common now, so the criteria is much more limiting today. Additionally, from a practical standpoint, including this criteria would result in no stocks passing this strategy the majority of the time, so it wouldn’t be useful for building model portfolios.
Historical Performance Review
We have been running our factor based strategy based on Ben Graham since 2003. As with all our strategies, we run both 10 and 20 stock models and run each of them using a monthly, quarterly, and annual rebalancing strategy. We use this data in an effort to find the optimal portfolio size and rebalancing period for each strategy. Given the deep value nature of the Graham model, it has tended to work best with the longer rebalancing periods. Below is the performance of our 10 stock Value Investor model based on Graham since its launch in 2003 using an annual rebalancing period. As a side note, during periods where there aren’t ten stocks meeting all of the strategy’s criteria, we will use the next highest scoring stocks (stocks passing all the criteria but one) to fill out the portfolio and ensure diversification.
Total Return: 371.0% S&P 500: 221.6%
(performance as of 9/18/2017)
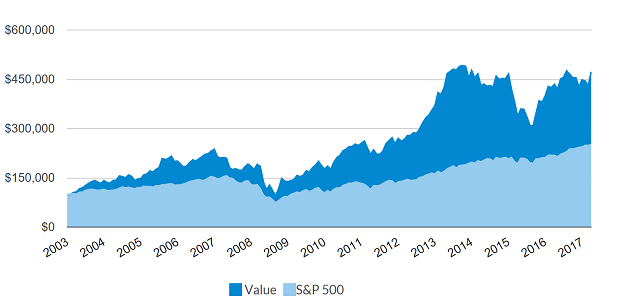
Below is the full performance history.
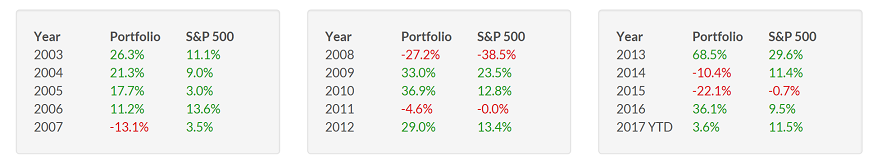
One of the interesting things to note is that despite a very strong long-term track record, this model has underperformed the S&P 500 in 6 of the 15 calendar years we have tracked, and some of those underperforming periods, including the current one that began in 2014, have been long and severe. We have tested many strategies over time that cover a wide range of investing styles, and one thing they all have in common is that they all go through significant periods where they do not work. But deep value models like this one tend to have the longest and most severe underperforming periods. Staying the course during those periods is the key to long-term success using these type of models.
Looking at the period from 2014 to the present, the portfolio has had two years where it underperformed the market by over 20%, and before bouncing back significantly, it was also close to 20% behind the S&P 500 in 2017. It would take an incredibly disciplined long-term focus to continue to follow a portfolio during a period like that, which is why focused factor-based investing is very difficult for most investors.
This strategy also tends to focus on beaten down areas of the market. For example, as of this writing, five out of the 10 top scoring stocks using the Graham model are in the retail sector. Because the model can get very concentrated in a particular area of the market, such as retail, the variability, both to the up and downside, can be accentuated. Additionally, the model tends to select mostly small and mid-cap names. Since the model’s inception, the average market capitalization of the holdings in the portfolio is around $2.2 billion, which is consistent with the overall US market investing universe, which is 80% small- and mid-cap.
No Predictions for Graham
One of the bedrock principles of Graham’s investment approach, which is incorporated in all of the models we run, is focusing on valuation and financials in order to assess a stock’s attractiveness. Graham viewed this as the difference between “prediction”, which is what analysts attempt to do when they forecast the future profitability of a firm and the stock price, and “protection”, which as Graham explained is focused on the “price of the issue at the time of study” and trying to assess if a margin of safety exists. Jason Zweig, who provided commentary in the revised edition of the Intelligent Investor explained the “prediction” and “protection” philosophy in this way:
This is one of the central points of Graham’s book. All investors labor under a cruel irony: We invest in the present, but we invest for the future. And, unfortunately, the future is almost entirely uncertain. Inflation and interest rates are undependable; economic recessions come and go at random; geopolitical upheavals like war, commodity shortages, and terrorism arrive without warning; and the fate of individual companies and their industries often turns out to the opposite of what most investors expect. Therefore, investing on the basis of projection is a fool’s errand; even the forecasts of the so-called experts are less reliable than the flip of a coin. For most people, investing on the basis of protection — from overpaying for a stock and from overconfidence in the quality of their own judgement — is the best solution.
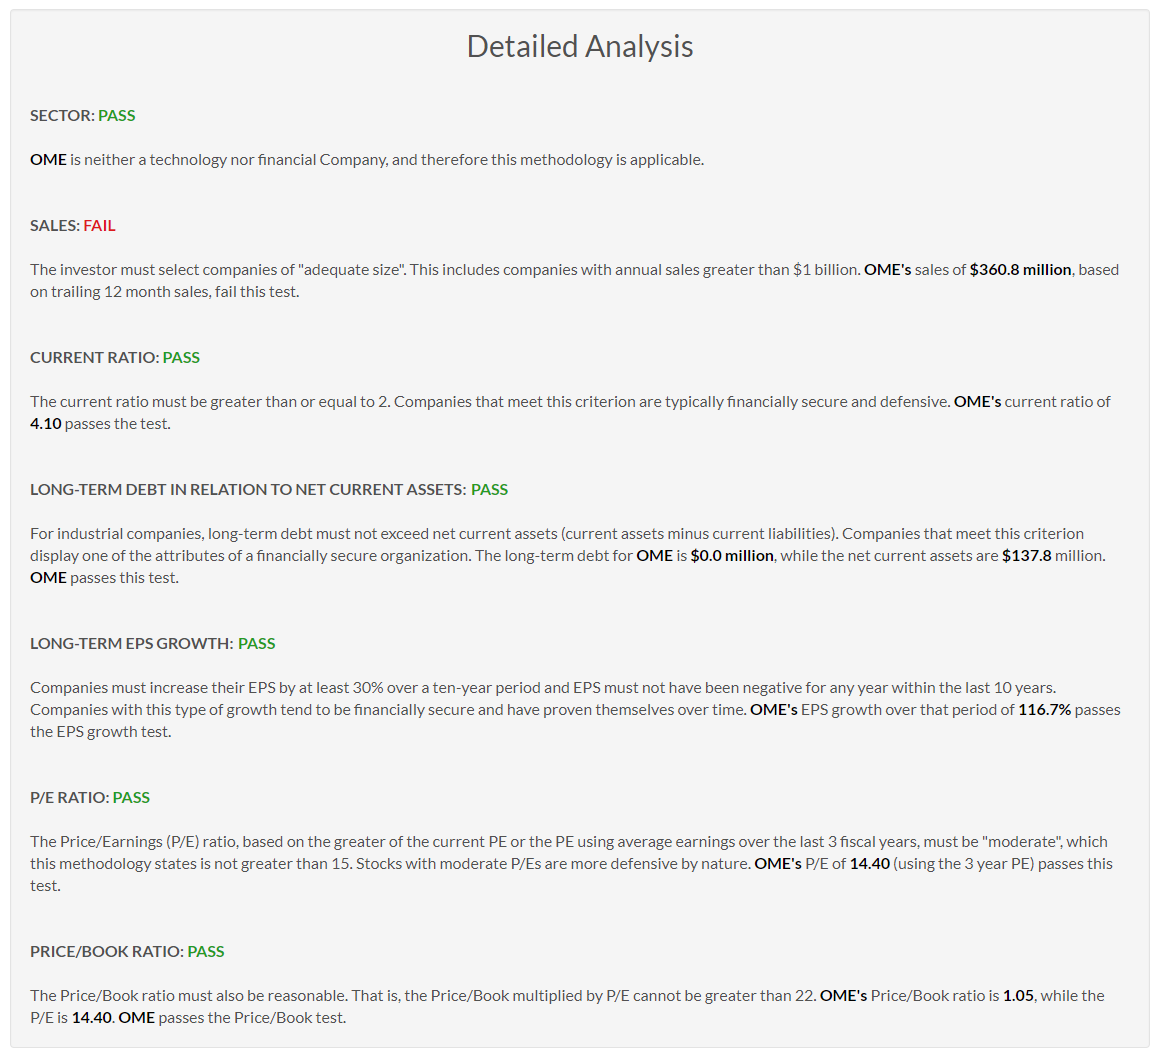
Detailed Criteria Example – Omega Protein (OME)
Below is an example of the application of this strategy to an individual stock. We take a look at Omega Protein, which currently meets most of Graham’s tests:
Conclusion
The Graham based model is a great play on focused factor-based value investing. With that comes great long-term returns, but also extended periods of underperformance that can test any investor’s patience and resolve. It is not for the faint of heart, but if you have the discipline to stay the course, the Graham strategy can be a great approach to produce long-term market beating returns.
Photo: Copyright: Le Moal Olivier / 123RF Stock Photo
Jack Forehand is Co-Founder and President at Validea Capital. He is also a partner at Validea.com and co-authored “The Guru Investor: How to Beat the Market Using History’s Best Investment Strategies”. Jack holds the Chartered Financial Analyst designation from the CFA Institute. Follow him on Twitter at @practicalquant.