
By Jack M. Forehand —
The massive move investors have made to passive vehicles over the past few years has been truly astounding. With most active managers underperforming their benchmarks by a wide margin recently and over longer periods of time, and charging higher fees to do it, investors have been moving their money out of active and into passive in droves.
A CNBC article in April sums up the magnitude of the move:
“Flows out of actively managed U.S. equity mutual funds leaped to $264.5 billion in 2016, while flows into passive index funds and ETFs were $236.1 billion, according to data provided by the Vanguard Group and Morningstar. That was the greatest calendar-year asset change in the last decade, during which more than $1 trillion has shifted from active to passive U.S. equity funds.”
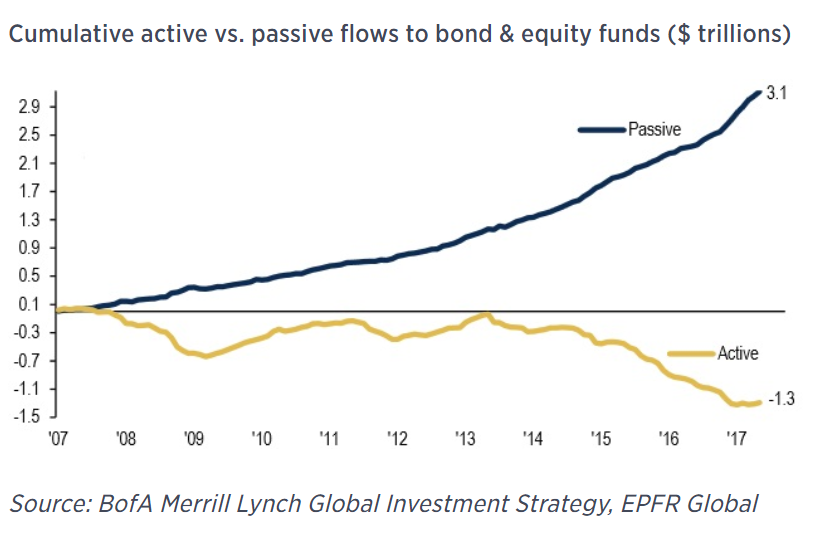
And things haven’t changed at all in 2017. A recent Business Insider article cites Morningstar data indicating that flows into passive vehicles continue to accelerate, with $10.8 billion flowing into passive equity vehicles in July, up from $9.3 billion in June, and outflows from active equity funds coming in at $19.6 billion in July, up from $14.6 billion in June. The longer term chart of active vs. passive flows below shows the volume of money that has moved into passive funds.
The Implications of the Passive Revolution
But what does this mean for investors?
That has been the big debate within the investment community in recent years, with major players in the markets coming down on both sides of the issue.
Some believe that passive investing is distorting the markets by driving up the prices of the largest stocks in market indices, particularly the S&P 500. Some have even worried about the potential for the situation to create a bubble.
Timothy O’Neill, head of asset management at Goldman Sachs, said the following:
“Trends in markets have a tendency to go too far one way or the other, and clearly the pendulum is swinging in favor of passive. But our belief is that market-cap beta, or passive indexing, is a potential bubble machine.”
On the other hand, believers in an efficient market argue that index buying hasn’t created any mispricing at all since even if index buying were to artificially inflate prices, active managers would step in and correct any moves that took individual companies away from their fair value.
So what is the answer to all of this? While I don’t think one side of the argument can be proven with any certainty, I thought it would be interesting to take a step back and look at the issue in the simplest terms possible to see if there is any evidence of market distortion and if so, which stocks it might have impacted the most.
To do this, I started by looking at the logic we use as an asset manager when we trade securities. When any money manager sends trades to their executing broker, they understand that the larger percentage of the daily volume those trades represent, the greater the likely impact those trades will have on the price of the stock they are buying or selling.
Each index buy order ultimately results in the stocks in the index being purchased in proportion to their market-cap. But larger stocks also tend to have more volume, so they can better absorb those trades without an impact to the price. So one way to look at which stocks may have been impacted the most by index buying would be to look for stocks that represent a much larger percentage of the index based on market cap than they do based on dollar trading volume.
Take a simple example. Say you have two stocks in an index, each representing 50% of its market value. But one represents 90% of the daily dollar trading volume in the index and the other represents 10%. If an investor buys an index ETF that follows this index, the order will be split among these two stocks. But the stock with more volume could better absorb that order and you would expect more price impact to the lower volume stock.
Looking at it another way, consider the case of Apple. Apple is one of the stocks I often hear discussed as one of the biggest beneficiaries of index buying since it is the biggest position in the S&P 500. But it also has the largest dollar volume in the S&P 500, so it can handle inflows better than any stock as well. Berkshire Hathaway, on the other hand, is the 6th biggest position in the S&P 500, but it ranks much lower based on dollar trading volume (for this analysis I used the B shares that are in the S&P 500). So you would expect it to be a bigger beneficiary of index buying than Apple. In fact, if index buying really is a huge factor in driving up stock prices, this model would argue that Warren Buffett and shareholders of Berkshire have been some of the biggest beneficiaries of passive flows.
Looking at the Market-Cap to Volume Ratio
But does any of this hold in the real world? To perform an oversimplified test, I ranked the stocks in the S&P 500 based on the ratio of the percentage they represent of its market cap divided by the percentage they represent of its average daily dollar volume. I did it as of the beginning of 2014, which is when index buying really picked up. If there is significant impact from index buying, you would expect the top stocks on this list to outperform the bottom stocks, all else being equal.
Here is a list of the 10 stocks that had the highest market-cap weight to dollar volume weight as of the beginning of 2014. These are the stocks you would anticipate would be most impacted by index buying. As you would expect, these are larger companies in more boring businesses that don’t trade a lot relative to their size.

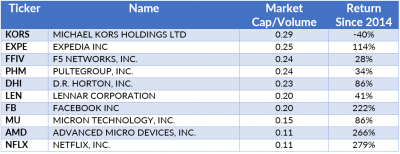
And here are the bottom 10 (the stocks that have high dollar volume weight relative to their market cap weight in the index). These are the companies you would expect to be affected least by index buying. What is interesting is that this list includes many of the stocks that have performed best in the index over this period, including two of the FAANG stocks.
To get an idea of if this concept has any merit on the whole, I split the index into two and looked at the average return of the top half vs. the bottom half. The top group (the stocks you would expect to be affected most by index buying) had an average return over the period of 36%, while the bottom half had an average return of 57%.
This is obviously a very inexact study and my intention wasn’t to prove anything conclusively, but if index buying has had the major impact on stock prices many suggest it has, you would expect to see the companies that should be affected the most going up the most on average. But that hasn’t happened.
This also doesn’t consider other indices, or stocks that aren’t in any indices at all. You could argue that since the buying in the S&P 500 index has been much greater than something like the Russell 2000, that is overvaluing all companies in the S&P 500 relative to smaller stocks. You could also argue that the smallest stocks that aren’t in any major indices are where the biggest opportunities are created because everything is being overvalued relative to them. I won’t deal with either of those here, but it is likely some of the same principles could be applied.
Evidence That Index Buying Distorts the Market is Unclear
As an active manager, I want to believe that index pricing has distorted the market because that creates opportunity. But I think at the end of the day, all the other forces in the market still dominate any impact index buying has, and those forces will drive stocks toward the price the market feels is warranted given the current facts.
That doesn’t mean that large-cap growth companies haven’t become overvalued the past few years. That is a separate debate. It just means that I think the evidence suggests that they have gone up because investors feel they are worth these higher levels, not because of passive index buying.
If you would like a notification when future posts are released, you can follow me on twitter at @practicalquant.
Photo: Copyright: feelart/123RF Stock Photo
——-

Jack Forehand is Co-Founder and President at Validea Capital. He is also a partner at Validea.com and co-authored “The Guru Investor: How to Beat the Market Using History’s Best Investment Strategies”. Jack holds the Chartered Financial Analyst designation from the CFA Institute. Follow him on Twitter at @practicalquant.