
By Jack M. Forehand, CFA (@practicalquant) —

“If you torture the data long enough, it will confess.” – Ronald Coase
“He uses statistics as a drunken man uses lamp posts—for support rather than for illumination.” – Andrew Lang
The stock market is really overvalued. Take a look at this chart below. The current Shiller PE ratio of 32 is double the long-term average of 16 and we are now at the highest level ever seen other than during the late 90s tech bubble. It seems pretty obvious that we are in another bubble and staying out of the market until it pops is the best choice.
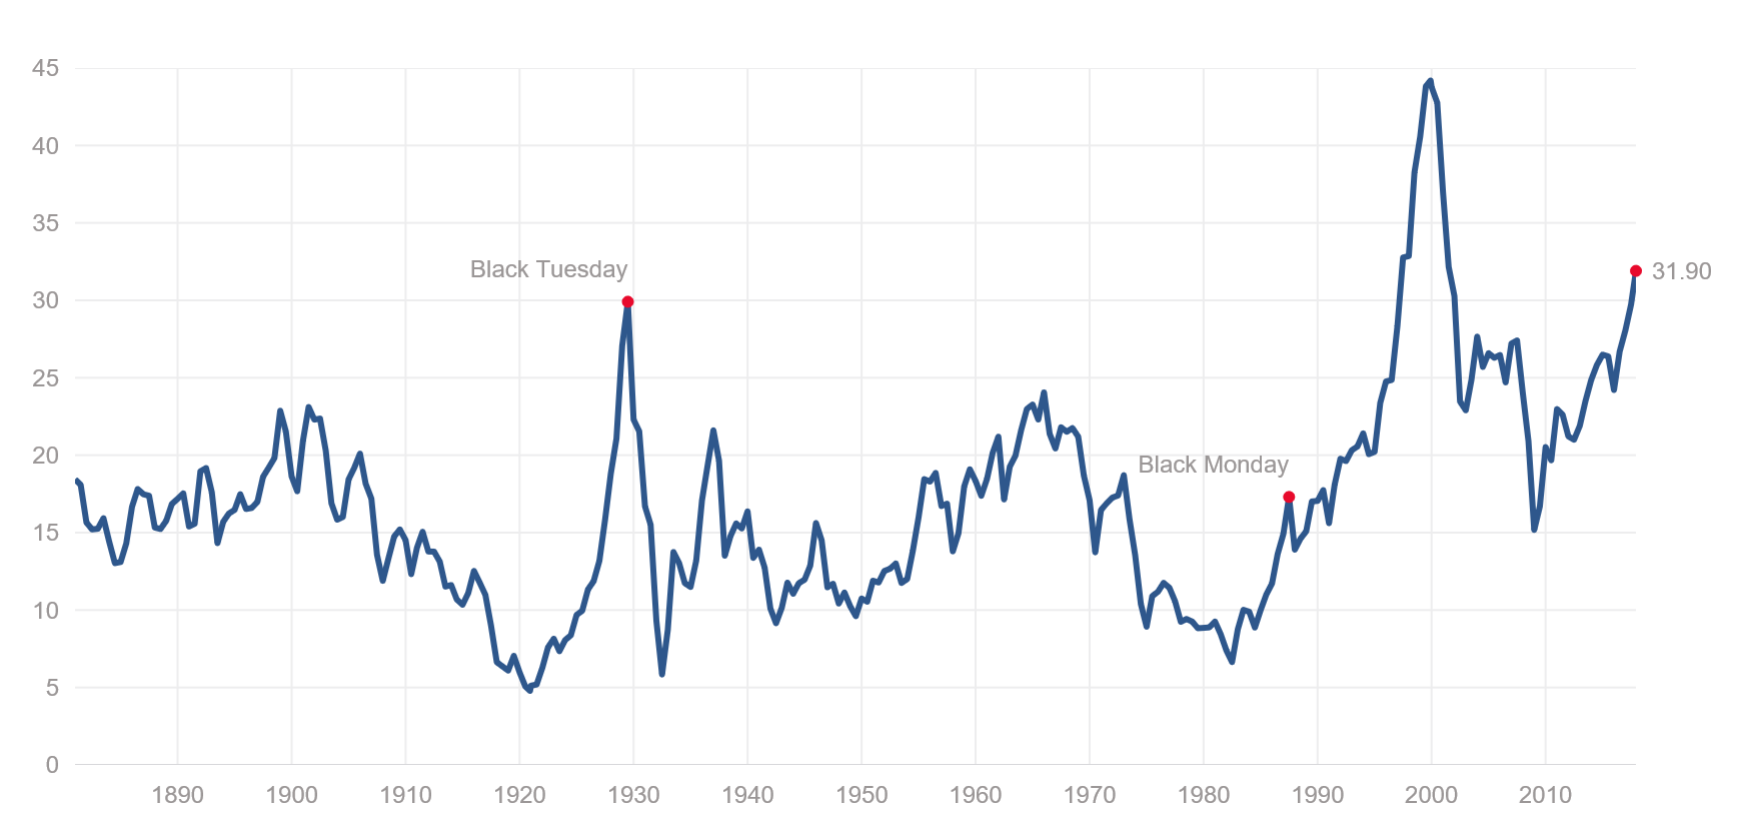
source: http://www.multpl.com/shiller-pe/
Actually, wait a second. Now that I think about it, that seems wrong. The stock market has to be evaluated relative to alternatives that are out there and bond yields are at historic lows. So this chart seems like a better option and the market seems fairly valued. I guess more significant gains are probably ahead of us.
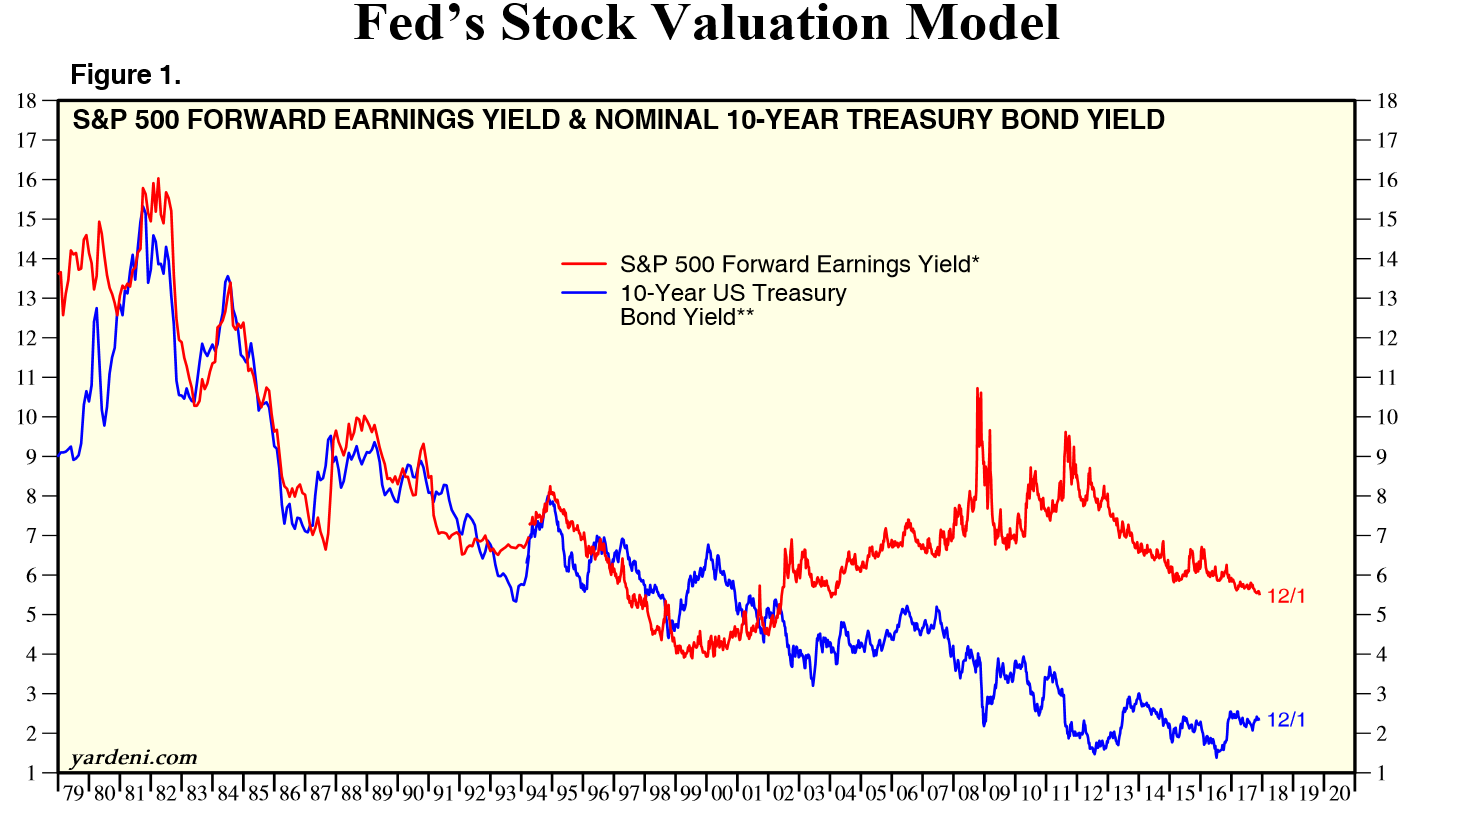
source: https://www.yardeni.com/pub/valuationfed.pdf
And I also saw Warren Buffett on CNBC a few months back and he was talking about how judging stocks relative to bonds was the way to go. This must be the right chart to use then and the market must be reasonably priced. So I see more gains ahead.
But now I have to figure out what to invest in.
I always hear that value stocks outperform over the long-term, so that is probably a good place to start. Looking at the academic research, I see that Fama and French wrote a research paper in 1993 that showed that value stocks outperform the market. And they used really long-term data to prove it, so what they found should hold regardless of what happens in the future. Plus, it just makes sense. I would rather pay less for a dollar of sales or earnings or book value than more. So I will just pick a group of value stocks and I should get better returns than the market.
But before I do that, just to be sure, let me take a look at what has happened since the paper was published. After all, it would be irresponsible of me not to do some of my own due diligence.
Let’s look at the performance of value vs. growth over the past 20+ years, just to make sure it still works. Here is the annual performance of the Russell 3000 Value Index vs. the Russell 3000 index since the beginning of 1995.
- Russell 1000 Value: 10.2%
- Russell 1000: 10.1%
That doesn’t make sense. Something must have been wrong with that research that showed that value outperforms because in 20+ years since the paper was published, I only got .1% of extra return. So much for this so-called value premium.
Now what I am going to do? Even though it turns out value doesn’t work, maybe I should focus on the second major conclusion from the Fama French paper and just buy small stocks. After all, small stocks must be able to grow faster than their larger counterparts and since they have less trading volume and less people following them, the market must be less efficient in the small-cap space.
But just to be sure, let’s confirm that the findings from the paper with respect to small-caps have held since then. To do that, I will look at the performance of the Russell 1000 index (which contains the 1000 largest stocks from within the Russell 3000) vs. the Russell 2000 (which contains the smallest 2000) since 1995.
- Russell 1000 – 10.1%
- Russell 2000 – 9.7%
Ok, now this is getting really frustrating. I used one of the more important research papers ever written about the stock market to try to figure out how to generate excess returns and both of the conclusions haven’t worked since its publication. Now I have no idea what data to trust.
Let me see if I can find some more research to fix the problem. I see there was a recent paper titled “P-hacking: Evidence from two million trading strategies” written by Chordia, Goyal and Saretto. They tested over 2 million trading strategies using every variable in the Compustat database to find which performed best. What was the result? They found that selecting stocks based on Common Stocks minus Retained Earnings divided by Advertising Expense worked best. So I will find a stock screener and use that to build my portfolio. That should be the key to beating the market for me.
Data Can Be Deceiving
Ok, now I can admit that I don’t actually believe much of what I wrote above. I am a big believer that timing the market is next to impossible and if you are going to try, valuations certainly aren’t what you should use. I also think that the value premium and the small-cap premium both exist, and small and value stocks will outperform over time. In fact, when you combine them together, you get even better returns since most factor returns are magnified in the small-cap space.
So what was the point of all of this? The point was to show that data is very dangerous. I am an evidence based investor and we only invest using quantitative strategies, so I am obviously a big believer in data, but it has to be used in the right way. When it isn’t, it can be incredibly destructive to investment returns.
To see how, let’s look at each of the things I talked about below.
First, the market is clearly trading at very high valuation levels using any historical metric other than metrics that compare stocks to bonds. But that means nothing in the short-term. The correlation between valuations and returns over the next year is very close to zero. So both of the market valuation arguments above were useless since valuation is not a reason to buy or sell stocks in the short-term.
And when it comes to value stocks or small stocks, you can look at the data and draw the conclusion that both outperform, and you can look at the data and say they don’t. It all depends on the metrics you use and the time frame. Whatever conclusion you want to draw, it is easy to find data to back it up. For example, when I looked at the performance of value stocks since 1995, I intentionally used the Russell indexes because I know they are primarily based on the Price/Book ratio, and I know that ratio hasn’t worked since then. So I cherry picked data to support the point I wanted to make. If I had used the PE Ratio or other valuation metrics, the conclusion would have been different.
And that research paper I cited? Its sole purpose was to highlight the risks of mining data to achieve the outcome you are looking for. It wasn’t meant to offer serious trading strategies.
The abuse of data happens all the time in investing. Anyone who wants to make a point can likely find data to support it. By manipulating the metric used or the time frame of that metric, almost any conclusion can be justified. It is up to us as investors to not just look at the data we are being presented with, but also judge whether it makes sense.
To do that, I have a few rules of thumb I always ask when presented with data.
- What is the agenda of the person presenting it?
- Does what I am seeing make sense logically?
- What is the time frame being used?
- Does other research support this conclusion?
Using those questions won’t catch every misuse of data, but it will catch a lot of them. So next time you see data used to draw any conclusion in investing, be skeptical of what you see and ask yourself whether it makes sense. That is the key to overcoming the dangers that lie within the data.
Photo: Copyright: ra2studio / 123RF Stock Photo
—–

Jack Forehand is Co-Founder and President at Validea Capital. He is also a partner at Validea.com and co-authored “The Guru Investor: How to Beat the Market Using History’s Best Investment Strategies”. Jack holds the Chartered Financial Analyst designation from the CFA Institute. Follow him on Twitter at @practicalquant.