
By Jack Forehand (@practicalquant) —

It is commonly accepted the beating the stock market over the long-term is really difficult. Over the past 15 years, about 70% of large-cap managers have trailed the S&P 500 and about 80% of small-cap managers have trailed the Russell 2000.
Investors in these funds have done significantly worse than that. The so-called behavior gap, which measures the difference between a fund’s performance and the performance of investors within the fund, is typically significantly wider for active funds than their index counterparts. This is caused by the fact that active funds introduce more opportunities for bad behavior. With index funds, investors tend to panic when the market is down and sell, which leads to poor performance relative to the funds they are invested in, but with active funds, investors also tend to panic when the fund is underperforming its benchmark, which leads to even worse investor returns.
Despite the extensive research that is available on this subject, investors continue to make the same mistakes and continue to be unwilling to sit though the periods of underperformance that are required to successfully implement an active strategy. From my experience, this is in part due to the fact that investors continue to expect consistent short-term results from strategies that aren’t setup to and can’t provide them.
This is in part due to our human nature, but also in part due to the narrative that there are managers who have accomplished this historically. For instance, Bill Miller was known as “the man who beats the market” for his 15 calendar year streak of beating the S&P 500, but behind that calendar year streak were many twelve month periods that he did not beat the market. A big part of his streak was luck due to when the calendar year begins and ends.
Miller himself admitted that. He said the following about the streak.
“As for the so-called streak, that’s an accident of the calendar. If the year ended on different months it wouldn’t be there and at some point the mathematics will hit us. We’ve been lucky. Well, maybe it’s not 100% luck—maybe 95% luck.”
Miller also went on to suffer an extended period of underperformance following the streak (which he has since bounced back from).
To illustrate just how difficult it is (read: impossible) to beat the market every year, I thought it would be interesting to take a look at the performance of the active strategies we follow over the past decade to see if even with the benefit of perfect hindsight, I could develop a strategy that would exhibit that kind of consistency.
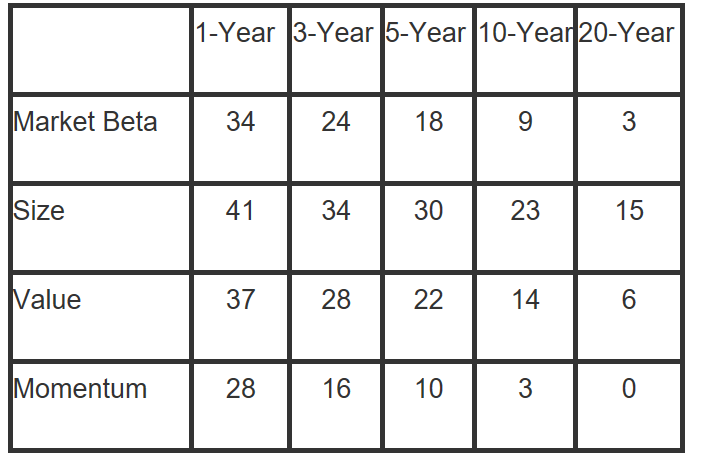
But first let’s establish a baseline. The chart below is from an excellent article by Larry Swedroe on the value premium. In the article, he looks at data from 1927 to the present and examines the chances that factor strategies will underperform in specific periods. Over a one-year period, he finds that all factors underperform at least 28 percent of the time. The chart confirms that sitting through periods of underperformance is the price you have to pay to generate outperformance with factor strategies over time.
https://www.advisorperspectives.com/articles/2018/06/14/in-defense-of-the-value-premium?channel=ETF
Using the factor-based strategies we run, I took a look at whether it is possible to eliminate this risk, even under perfect circumstances.
Taking a step back first, let me provide a little background on our strategies. We are big believers in factor investing, but also recognize that there are many investors out there who are much smarter than us. So rather than try to reinvent the wheel, we have combed through every book and research paper we could find to identify factor strategies with a track record of beating the market over the long-term. The result of that effort is currently 45 factor-based models that run the gamut of investing styles, ranging from value to growth to momentum. Each of these models was selected because it had a long-term record of beating the market and was completely rules based. We run focused versions of these strategies which hold between 10 and 20 stocks in an effort to maximize the potential for long-term outperformance.
Despite their long-term successful track records, these strategies on their own each suffer from the same problem illustrated in the chart above that all active strategies do. They can’t do it consistently. On average, they underperform the market in about 40% of one-year periods, and even the most consistent among them underperform the market 30% of the time over a one year time frame.
By blending different strategies together, in theory we can reduce that underperformance by focusing on combining different types of strategies together (i.e mixing value, momentum, quality etc). This should serve to increase consistency of returns. But does it move us close to our goal of consistent annual performance?
To test this, I created every potential three strategy blend of our models that exists. With 45 strategies to choose from, that creates about 14,000 unique possible combinations. The goal was to find some combination of uncorrelated strategies that beats the market in every 12-month period.
This attempt, despite having the benefit of perfect hindsight, was a complete failure. Not one of these 14,000 potential combinations beat the market every year.
With 45 strategies to choose from that have a long-term record of beating the market, and assuming I could have known in advance which combination of them would have produced the most consistent return over the past decade, I still could not come up with one that beats the market every year. The best combination outperformed in 88% of one-year periods, and even that is completely unrealistic because I could have never identified that one combination out of 14,000 possibilities in advance.
The point of all this is that if this completely flawed test with the benefit of perfect information still didn’t beat the market every year, then it just isn’t possible, and any investor following an active strategy needs to incorporate this fact into their expectations from the outset. And it’s not just one-year periods where underperformance is a problem. As the chart above shows, the same is true for three-year periods, five-year periods, and even ten-year periods. The odds go down as the period gets longer, but the only period in the entire chart that showed no underperformance historically was momentum over 20 years.
The other point to understand is that every decade is different. So even if I could have found a strategy that worked in 100% of twelve-month periods in the past decade, which was dominated by growth and momentum, it would be very unlikely to work in the next decade, where different types of stocks will likely outperform.
Everyone wants a perfect strategy. Everyone wants to beat the market every year. The reality, though, is that just isn’t possible. If you want to invest actively, there is perhaps no more important fact than that to accept from the outset. The good news is that even if you can’t beat the market every year, there is a strategy that guarantees you will meet its returns 100% of the time. That strategy is indexing and it offers a superior option for those who can’t handle the periods of underperformance.
I remain a big believer in active factor-based strategies and their ability to beat the market in the long-term. They will just never do it consistently and only those who recognize that and can endure the pain that comes with it will ever realize that potential.
Photo: Copyright: convisum / 123RF Stock Photo

Jack Forehand is Co-Founder and President at Validea Capital. He is also a partner at Validea.com and co-authored “The Guru Investor: How to Beat the Market Using History’s Best Investment Strategies”. Jack holds the Chartered Financial Analyst designation from the CFA Institute. Follow him on Twitter at @practicalquant.