
By Jack Forehand (@practicalquant) —
The consensus opinion among followers of the market has been pretty consistent for some time now. The general belief is that the stock market is trading at one of the highest valuations it ever has, and that those lofty valuations bode very poorly for the future.
I understand the narrative very well because I have been one of the people saying it.
The data also backs it up. Market valuations tell you essentially nothing about where the market is going in the next year, but they tell you a lot about what returns to expect in the next decade. With the market reaching valuations at the end of 2017 that were the second highest ever based on many metrics (other than the late 90s tech bubble), valuations were telling you to expect much lower than average returns going forward.
Some of that picture has begun to change, however.
There are several reasons for that. First, we have had a ten percent correction. By almost any metric, the stock market was much more than 10% above its historical average prior to the correction, so this certainly has not dramatically changed the valuation picture on its own, but it is a contributing factor.
The second thing that has changed is the tax cut that passed at the end of last year. It will single handedly boost earnings more than 10% this year. When you combine that with the correction, you have both sides of the PE ratio changing favorably. The “P” is falling and the “E” is rising. That means that if the stock market stays where it is now (barring any unforeseen economic changes), the stock market’s valuation based on trailing twelve-month earnings will be significantly lower at the end of this year than it was in the beginning.
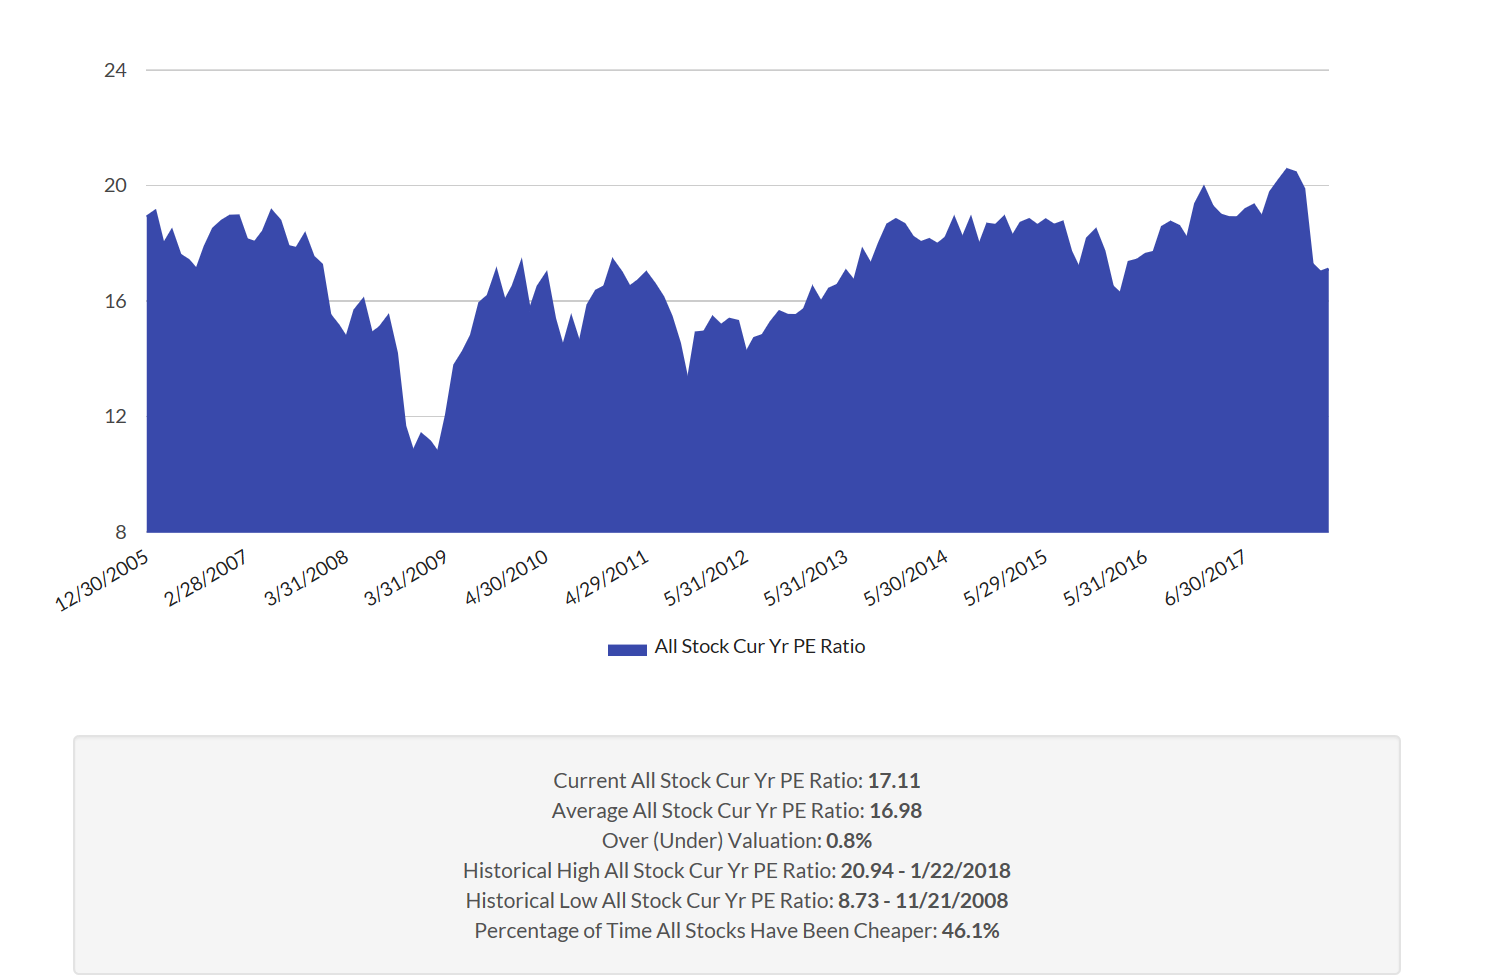
The illustrate this, take a look at the chart of the median PE ratio of the 2800 stocks in our investable universe since 2005.
Source: https://www.validea.com/market-valuation
In late January this year, the market’s valuation reached the 100th percentile (meaning it was the most expensive it had been since 2005). But the recent correction has moved it from dramatically overvalued to just very overvalued territory. Going forward, as earnings that include the tax cut get reported each quarter, it will continue to put downward pressure on valuations, even if prices don’t fall.
To understand what that might look like by the end of the year, take a look at this chart.
Source: https://www.validea.com/market-valuation
This chart looks at the market’s valuation over the same period, but it uses the current fiscal year EPS estimate instead of past earnings. As you can see, the valuation based on 2018 earnings estimates looks very average once the effects of the tax cut are included.
Perhaps the most common valuation metric used by followers of the market is the Shiller PE (or CAPE ratio). This ratio is what is most often utilized to project long-term returns. It has the benefit of not being affected by where we are in the economic cycle since it uses ten years of earnings instead of just one.
The Shiller PE was also at the second highest level it has ever seen going into this year (again other than the tech bubble). It peaked above 33 in January and has now fallen to 31.4. It is still very high relative to history, but it has improved.

Source: http://www.multpl.com/shiller-pe
Our own internal Shiller PE calculation indicates that it is very inflated relative to a more recent average as well. The median Shiller PE of all stocks in our universe currently stands at around 34, down from a value of 36 earlier this year.

Source: https://www.validea.com/market-valuation
The conclusion from this chart is similar to the one from the standard PE chart. Stocks are still very expensive, but not as expensive as they were coming into this year.
But something is about to change with the Shiller PE. If look at the table below with the past ten years of earnings for the S&P 500 (the 5th column), you will see that two years in the calculation stick out as outliers. Earnings in both 2008 and 2009 were far lower than all the years following them and the years before them due to the financial crisis. But at the end of this year, 2008 will be removed from the calculation and replaced by 2018, which is likely to be a very strong earnings year due to the tax cut. The affect of that change alone will reduce the Shiller PE by 3 points. And eliminating 2009 and replacing it with a likely much stronger earnings year the year after will have a similar effect. The result is there will be a force bringing down the Shiller PE regardless of market movement.
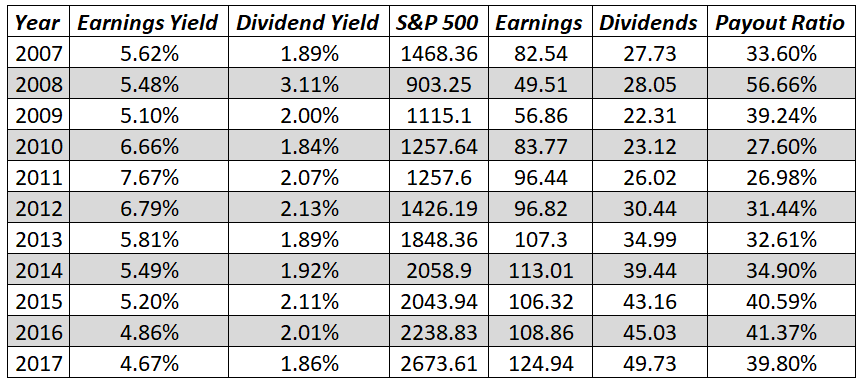
Source: http://pages.stern.nyu.edu/~adamodar/New_Home_Page/datafile/spearn.htm
All of this is not to say that the market isn’t expensive. If you take a balanced look at all the various market valuation metrics, it still likely is. The point is that the confluence of a market correction, rising earnings due to the tax cut, and the fact that the outlier years of 2008 and 2009 will be removed from the Shiller PE ratio in the next couple of years will all act to compress valuation multiples, even if the market price doesn’t fall any further. That doesn’t mean the market won’t go down. That doesn’t mean we won’t have a bear market. It just means that the case of those who call this one of the most expensive markets in history is likely to get worse by the day as we move forward.

Jack Forehand is Co-Founder and President at Validea Capital. He is also a partner at Validea.com and co-authored “The Guru Investor: How to Beat the Market Using History’s Best Investment Strategies”. Jack holds the Chartered Financial Analyst designation from the CFA Institute. Follow him on Twitter at @practicalquant.