By Justin Carbonneau (@jjcarbonneau)
—-
Talk about the Markets and/or Invest with Justin
—-
A centerpiece for most systematic investing models is a “refreshing” of the portfolio positions, which is also often referred to as rebalancing. Simply put, on each rebalancing date certain positions are removed from the portfolio and replaced with better scoring stocks based on the strategy being followed. When you run investment models and the underlying company fundamentals and valuations change, it’s important to let the models find the best opportunities and remove those names that have fallen in score.
On the surface, rebalancing seems simple. All investment managers do it in one way or another. As Warren Buffett once explained, one of the reasons he sells a stock is because the fundamentals or industry landscape changes. Buffett rebalances, or changes Berkshire’s portfolio or position sizing based on the investment prospects in the portfolio and in the market. But when it comes to quantitative investing strategies that scan and sort hundreds or thousands of stocks, this rebalancing technique becomes both an asset and a liability.
High turnover, which results in tax inefficiency and high direct and indirect trading costs, is often a detraction from investor returns. Finding the best ideas and adding them to the portfolio in an attempt to capture alpha before the rest of the market realizes the value, along with imposing a disciplined sell methodology, are a few of the benefits of systematic investing.
With these things in mind, we asked ourselves if we could develop a rules-based approach that lowers turnover, improves tax efficiency and attempts to make decisions like a would when buying and selling stocks that have gains or losses in a portfolio, all while still maintaining a disciplined, systematic approach.
Rebalancing Redefined
One of the things we have done since we launched our model portfolios back in 2003 is to offer different rebalancing timeframes. Since the outset, we have been running portfolios that are rebalancing monthly (every 28 days), quarterly (4 times a year) and annually. As you would expect, the monthly portfolios have the highest amount of turnover followed by the quarterly and then the annual models.
But we have been working on a system for some time now that tries to incorporate the best aspects of each of these. We wanted to find a system that offered the advantages of getting the highest scoring stocks into the portfolio that monthly rebalancing offers, while at the same time achieving the lower turnover of annual rebalancing. The end result of this process was our new tax efficient rebalancing system that follows a frequent and consistent rebalancing (i.e. monthly changes) but maintains a focus on doing it in a way that considers tax consequences and lowers turnover.
How it Works
Under the normal rebalancing (think monthly rebalancing), our models select the top-rated stocks for each of the portfolios we run and stocks are added and removed based on the ranking of each stock vs. all stocks eligible to be bought and sold in the portfolio. Because the strategies we run sort through thousands of stocks, and fundamentals and prices are constantly changing, there are naturally a large number of changes that are made.
For many investors, a regular disciplined re-assessment of the securities held in the portfolio is valuable because new opportunities emerge and stocks fall in score (because either prices have gone up, gone down, or the fundamentals have changed) and a set rebalancing approach automatically incorporates a consistent sell discipline into the process that is important over time. However, when rebalancing monthly (or quarterly), turnover can be high and the tax consequences in taxable portfolios can be high.
Under our new tax efficient rebalancing methodology, we still follow a monthly portfolio review, but rather than just removing all stocks in the portfolio that have fallen in score, we are looking at a set of criteria in order to determine whether or not selling the position makes sense from a turnover, tax and fundamental standpoint.
Below are the steps that are incorporated into our tax efficient process.
Four Factor Sell Score
To determine if a stock is eligible to be sold from one of the tax efficient portfolios, we create a sell score using four different factors. The sell score is then used to sell approximately 10% of the portfolio on each rebalancing. The net result in the implementation of the sell score system are portfolios that are able to produce almost entirely all long term gains, all while staying 100% percent systematic and quantitative in the investment process.
[1] The first step in the sell score is to determine how far down the list a stock has fallen based on the strategy that selected it. For instance, if a stock in one of our 10 stock portfolios moves from the 8th to 12th overall position, that is not a big decline, but if it falls from 8th to the 200th spot, that is a large relative decline. Stocks are scored based on how far they have fallen in score.
[2] The next step is to look at whether or not there is a gain or loss on the position. Stocks with losses are always eligible for sale, and therefore get a higher sell score, while stocks with gains obtain a lower sell score.
[3] The holding period is the next factor taken into account. For those stocks we have gains on, short term holding periods receive a lower sell score than stocks that have been held over long term periods.
[4] The last input into the sell score is the magnitude of the gain. For instance, if we have a stock we’ve held for 10 months and we’re up a mere 2%, the sell score would be higher than if we were up 50% on another position held over that same period.
On each portfolio rebalancing, the positions in all of our tax efficient portfolios are scored using this system. The stocks with the highest sell score are eligible to be sold, and the system will look to sell as many positions as it can with the target of selling approximately 10% of the portfolio each month.
Let’s Look at an Example
It helps to look at an example, so let’s look at one of the top growth models on Validea – the P/B Growth Investor strategy based on the academic research and tests by Partha Mohanram. You can learn more about the model here or you can read my piece on the strategy here.
In August, we rebalanced the monthly, quarterly and tax efficient portfolios. As you can see from the side-by-side table below, the tax efficient model had one change – Intuit came in and Shutterstock was removed, while the monthly and quarterly 10 stock portfolios had four buys/sells and five buys/sells, respectively. Note: in the video above I demonstrated the 20 stock portfolio, which had two changes in the last rebalancing under the Tax Efficient method.

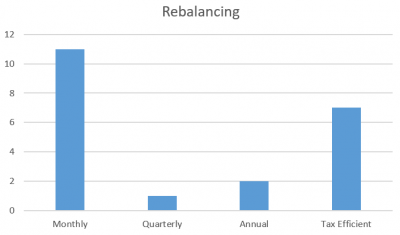
Because we track the performance of our model portfolios, we are able to see how the new tax efficient rebalancing approach stacks up compared to the other approaches. Using the optimal portfolios, which shows the top performing portfolio in terms of size and rebalancing for each distinct model, we can see that the monthly rebalanced portfolios still make up the bulk of the best performing strategies, but the tax efficient portfolios are now in the #2 spot with 7 out of the 22 models performing best when rebalanced using our tax efficient method. The returns, which are model returns and do not reflect real money management performance, are calculated before tax. If you were to include the difference between expected short and long term capital gains, the number tax efficient portfolios on top would be even greater.

And while we don’t want to read into it too much, the best performing model on Validea since inception based on the annualized outperformance over the S&P is the now the previously mentioned P/B Growth Investor Tax Efficient 10 stock model. Since its inception in March of 2006, the model portfolio has produced 9.1% annual excess outperformance over the S&P 500 (or a total return of 567% vs. 120% for the S&P 500, excluding dividends). Prior to the launch of the tax efficient models, the Twin Momentum investor monthly portfolio was the best, but that is now dethroned.
Another interesting observation is that across all of the permutations of portfolios (i.e. 10 and 20 stock monthly, quarterly, annual and tax efficient rebalanced portfolios) the 20 stock tax efficient models have the highest percentage of portfolios outperforming the market since inception.
Many Ingredients to Success
Successfully following a systematic investment strategy is a challenging process. Maintaining discipline and the right mindset, finding a strategy you believe in and can follow for the long term, implementing the strategy cost effectively and intelligently are some of the most important things an investor needs to do. The tax efficient portfolios on Validea present another option for those investors who are looking for strategies that marry a disciplined stock selection process with an intelligent and tax efficient sell discipline.
Photo: Copyright: https://www.123rf.com/profile_hin255


